Nagios Core Installation and Configuration on Ubuntu Server
This article is part of our Academy Course titled Nagios Tutorial for IT Monitoring.
In this course, we provide a compilation of Nagios tutorials that will help you set up your own monitoring infrastructure. We cover a wide range of topics, from installation and configuration, to plugins and NRPE. With our straightforward tutorials, you will be able to get your own projects up and running in minimum time. Check it out here!
Whether you are an engineer in charge of monitoring a large and complex network infrastructure, a system administrator of a relatively small number of machines, or a just a regular user who needs to check on the availability of a couple of machines and important services in your home network, it is critical to understand the importance of and implement a monitoring solution.
As such, Nagios is the answer for you. In addition to providing monitoring of hardware resources (processor load, disk usage, etc) and the availability of network services (HTTP, FTP, SMTP, SSH, etc), this open source tool also offers alerting (via SMS or email through the use of plugins) in the wake of undesired events, and allows you to identify potential problems before they occur.
On top of it, through its web interface Nagios also provides access to availability data at a quick glance to share with the leaders of your organization. This same feature can also help you plan in advance for necessary upgrades to your infrastructure.
In this tutorial we will show you how to install and use Nagios Core in an Ubuntu 14.04 server. We will then demonstrate how to monitor the availability (whether the host is up or down) in a CentOS 7 system, and the status of the web service running therein. In a future guide, we will also add more advanced monitoring features for services on the same host.
Installing Nagios Core
Nagios Core has a free-of-cost solution that features complete infrastructure monitoring, hundreds of addons, and forum support. Other versions (Student VM, Pro, and Business) include these and other features as well, but they are all paid options. However, for our present purposes, the Free DIY (Do-It-Yourself) edition provides the functionality that we need, so we will show you how to download and install it on your Ubuntu 14.04 server.
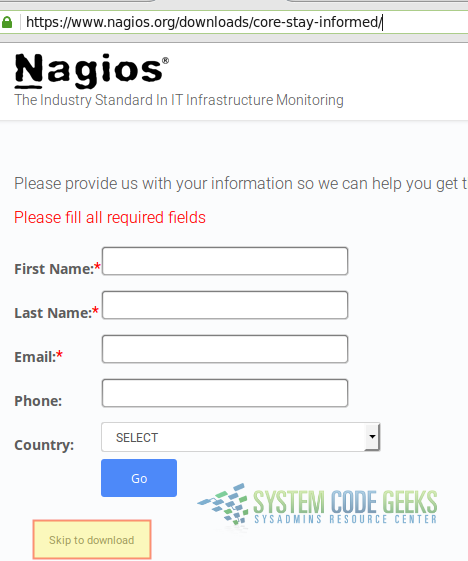
Although Nagios can be installed from the Ubuntu repositories, the available version (3.5.1) is a bit outdated. For that reason, we will install the application using the code package from https://www.nagios.org/downloads/core-stay-informed/ (you can skip the form that asks for details of your implementation by clicking on Skip to download as you can see in Fig. 1).
STEP 1 – Before we download and install Nagios from the project’s website, we will need to install and configure some additional dependencies. These consists of a complete LAMP stack and several development libraries that will assist us in building Nagios from source. Also, we will install an email service (postfix) to handle notifications and additional utilities (mailutils) to check those notifications on the local machine:
sudo aptitude update && sudo aptitude install apache2 php5-mysql mysql-server libapache2-mod-php5 php5-mcrypt php5-gd php5-curl build-essential libgd2-xpm-dev openssl libssl-dev xinetd apache2-utils unzip wget postfix mailutils
mysql-server, you will be prompted to set a password for the MySQL root user. Make sure you choose a strong password which is easy to remember. When prompted to choose a mail server type for postfix, choose Local Only, as we will be delivering notifications to a local user.If you want to learn more about each of the above dependencies in detail, you can use
aptitude show dependency, where you will need to replace dependency with one of the package names listed previously.STEP 2 – Once you have installed the dependencies listed above, download the source code for the latest Nagios stable release (at the time of this writing it’s 4.1.1):
wget https://assets.nagios.com/downloads/nagioscore/releases/nagios-4.1.1.tar.gz">https://assets.nagios.com/downloads/nagioscore/releases/nagios-4.1.1.tar.gz
and untar it:
tar xzvf nagios-4.1.1.tar.gz
We will later change directory into the folder where we just extracted the contents of the tarball. By now, proceed with the next step.
STEP 3 – Create a user and group for Nagios-related processes to run, then add the nagios and www-data (Apache) users to the Nagios group (nagioscmd):
sudo useradd nagios
sudo groupadd nagioscmd
sudo usermod -aG nagioscmd nagios
sudo usermod -aG nagioscmd www-data
Particularly, the nagioscmd group will be needed to run commands via the web interface.
STEP 4 – Change directory to the folder where you unpacked the Nagios source code earlier:
cd nagios-4.1.1
Find out where the mail binary is located:
which mail
Most likely, the above command will return /usr/bin/mail. You will use the --with-mail configure option followed by this absolute path below. Then do:
sudo ./configure --with-nagios-group=nagios --with-command-group=nagioscmd --with-mail=/usr/bin/mail
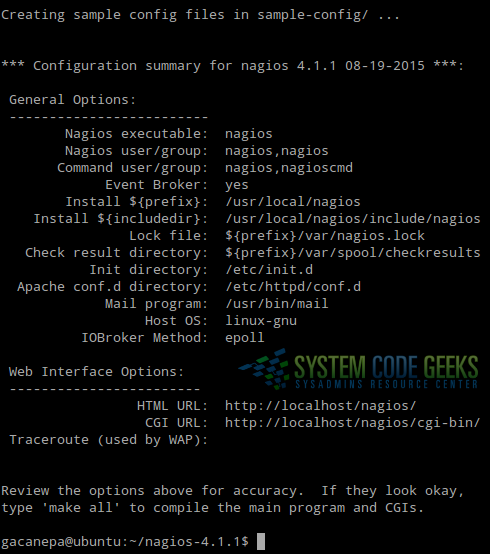
You will be given the chance to take a second look at the configuration options before proceeding, as shown in Fig. 2:
If everything looks correct, proceed with Step 5. Otherwise, correct the corresponding option in the configure statement above and try again.
STEP 5 – To compile Nagios and install auxiliary files and extra features, run the following commands. Keep in mind that only sample configuration files will be installed, and you will still need to go through the documentation for more information on how to actually define entities (devices, hosts, services, etc) to fit your particular needs.
sudo make all
sudo make install # The main program, CGIs, and HTML files
sudo make install-init # The init script in /etc/init.d
sudo make install-config # Sample config files in /usr/local/nagios/etc
sudo make install-commandmode # Fix permissions on the directory for the external command file
sudo /usr/bin/install -c -m 644 sample-config/httpd.conf /etc/apache2/sites-enabled/nagios.conf # The Apache config file for the Nagios web interface
sudo make install-exfoliation # Exfoliation theme for the user interface
STEP 6 – Create an admin user (and set password, see Fig. 3) to access the web interface and enable the Apache rewrite and cgi modules:

sudo htpasswd -c /usr/local/nagios/etc/htpasswd.users nagiosadmin
sudo a2enmod rewrite cgi && sudo service apache2 restart
The username / password pair that you will use to access the web interface will be stored in /usr/local/nagios/etc/htpasswd.users. To restrict permissions, we will change the group owner to nagioscmd and only allow read permissions for the members of that group:
sudo chgrp nagioscmd /usr/local/nagios/etc/htpasswd.users
sudo chmod 640 /usr/local/nagios/etc/htpasswd.users
STEP 7 – Finally, let’s add the necessary symbolic link to the sites-enabled directory, restart Apache, and start nagios. Please note that the actual file in sites-available was created in Step 5.
sudo ln -s /etc/apache2/sites-available/nagios.conf /etc/apache2/sites-enabled/
sudo service apache2 restart
sudo service nagios start
At this point, Nagios and Apache should be running. It is time to launch the web interface to check.
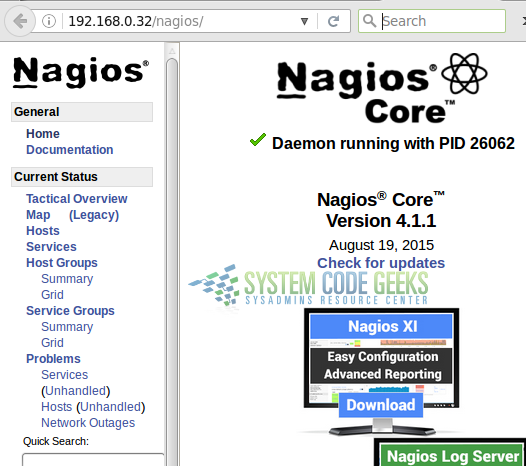
STEP 8 – Verify that you can access the Nagios web interface at http://ServerIP/nagios. In our case, the ServerIP is 192.168.0.32. Use nagiosadmin as username and the password you chose in Step 6. If everything goes as expected, you should see the user interface as shown in Fig. 4:
STEP 9 – Download and install Nagios plugins (we will dive more deeply into this topic in the next tutorial).
To begin, find the latest version from http://nagios-plugins.org/download/ (2.1.1 at the time of this writing) and download it:
wget http://nagios-plugins.org/download/nagios-plugins-2.1.1.tar.gz
tar xzvf nagios-plugins-2.1.1.tar.gz
cd nagios-plugins-2.1.1
sudo ./configure --with-nagios-user=nagios --with-nagios-group=nagios --with-openssl
sudo make
sudo make install
STEP 10 – Finally, we need to modify the default contact that will receive alerts. Open /usr/local/nagios/etc/objects/contacts.cfg and replace the address in the email directive for an administrative account (gacanepa@ubuntu in the below example), as indicated in Fig. 5:

Once the above 10 steps have been completed successfully, we can proceed to further configure Nagios.
Configuring Nagios
To organize the hosts definitions and monitoring configuration, we will create a directory named /usr/local/nagios/etc/servers:
mkdir /usr/local/nagios/etc/servers
and will tell Nagios to process all configuration files (*.cfg inside this directory) by uncommenting the following line in /usr/local/nagios/etc/nagios.cfg:
cfg_dir=/usr/local/nagios/etc/servers
Inside /usr/local/nagios/etc/servers we will add a basic configuration file (centos7.cfg) to monitor the availability of the remote CentOS 7 system (IP address: 192.168.0.29) and the status of the HTTP service in that host by checking the index.html file inside the DocumentRoot directory:
define host {
host_name               centos7
alias                   My CentOS 7 server
address                 192.168.0.29
max_check_attempts      3
check_period            24x7
check_command           check-host-alive
contacts                nagiosadmin
notification_interval   60
notification_period     24x7
}

define service {
use                     local-service
host_name               centos7
service_description     HTTP
check_command           check_http!-I 192.168.0.29 -u /index.html
notifications_enabled   1
}
As per the above configuration, Nagios will attempt to reach the host 3 times before raising an alert (max_check_attempts). Once it detects an anomaly, it will send notifications every 60 minutes (notification_interval).
Before restarting Nagios, you can check the configuration file for errors (this will also check all other files invoked by nagios.cfg) as follows:
sudo sh -c "/usr/local/nagios/bin/nagios -v /usr/local/nagios/etc/nagios.cfg"
Then let’s restart Nagios:
sudo service nagios restart
and refresh the web interface. The newly added host should now show up. Refer to Fig. 6 for more details.
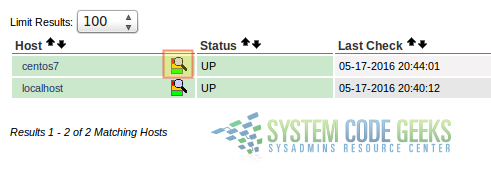
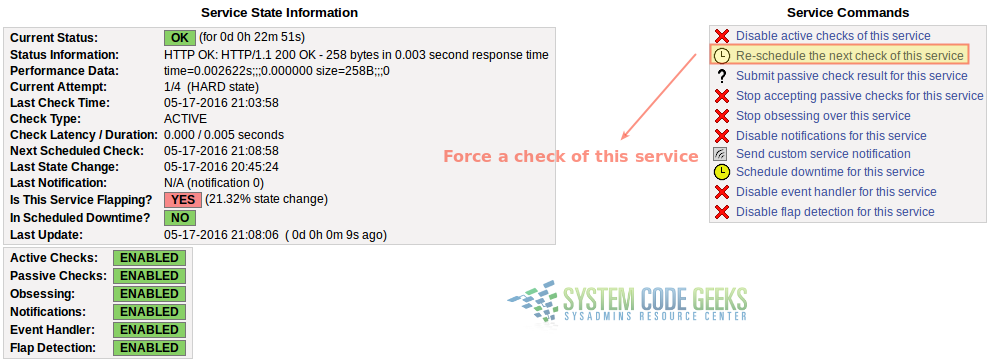
If you click on the magnifying glass icon next to centos7, we will see the list of services defined for this host. We can then click on the service name to display the corresponding stats (see Fig. 7). Using the same interface, you can force a check of this service and perform other operations (Service Commands).
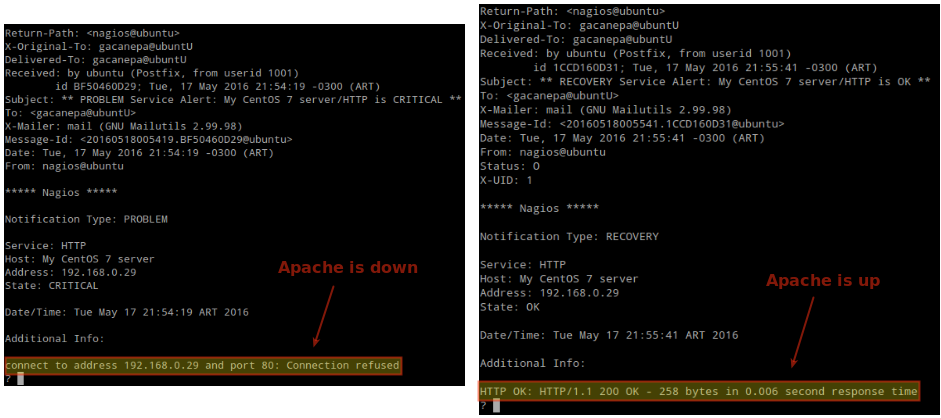
If we now stop the service in the remote host (systemctl stop httpd) or shut the machine down (poweroff), we should receive notifications in the email account we defined in Step 10. To read your emails, you will use the mail command (see Fig 8):
enable_flap_detection flag to 0 in /usr/local/nagios/etc/nagios.cfg.Last, but not least, remember to enable Nagios to start on boot:
sudo ln -s /etc/init.d/nagios /etc/rcS.d/S99nagios
Congratulations! You have successfully installed Nagios Core in your Ubuntu 14.04 server and set up monitoring for the availability of a CentOS 7 machine and the Apache service running therein.
Summary
In this article we have explained how to install the latest version of Nagios Core and plugins from source, and how to configure monitoring for a host and a specific service. In addition, we set up email alerts to receive notifications when the host or the chosen service experience issues. In the next guide we will dive more deeply into the use of plugins for checking a wide variety of common services.


